Customer satisfaction and firm performance: insights from over a quarter century of empirical research
Emphasizing customer satisfaction as a strategic lever for enhancing business performance is a widespread business practice. However, just over 25 years of empirical studies by academic researchers has produced evidence that is sometimes contradictory. Hence, greater academic clarity and improved managerial understanding could result from a meta-analysis of the customer satisfaction-business performance relationship. To that end, the authors analyzed 251 correlations from 96 studies published between 1991 and 2017. While the satisfaction-performance relationship is positive and statistically significant on average (r = .101), more meaningful insights emerge from the explication of moderating and mediating relationships. Illustrative of these insights is the finding that satisfaction is more appropriately depicted as mediating the effects of selected marketing strategy variables on firm performance outcomes. Moreover, when satisfaction is viewed in the right setting using the right satisfaction and performance measures, a most favorable contingencies (MFC) perspective, the estimated correlation is reasonably strong (r = .349).
This is a preview of subscription content, log in via an institution to check access.
Access this article
Subscribe and save
Springer+ Basic
€32.70 /Month
- Get 10 units per month
- Download Article/Chapter or eBook
- 1 Unit = 1 Article or 1 Chapter
- Cancel anytime
Buy Now
Price includes VAT (France)
Instant access to the full article PDF.
Rent this article via DeepDyve
Customer satisfaction, loyalty behaviors, and firm financial performance: what 40 years of research tells us
Article Open access 03 March 2023
Customer satisfaction and international business: A multidisciplinary review and avenues for research
Article 16 August 2022
Defining Customer Satisfaction: A Strategic Company Asset?
Chapter © 2020
Explore related subjects
Notes
Another market measure of financial performance that has been the focus of investigation in the satisfaction-performance literature is Tobin’s q. However, concerns have been raised recently by Bendle and Butt (2018) regarding the use and misuse of Tobin’s q in marketing (see Bendle and Butt 2018). Because of these concerns (brought to our attention by a reviewer for which we are grateful, and a reviewer’s related suggestion), the analysis of Tobin’s q is presented in the Supplemental Material.
A breakout of the mean satisfaction-performance correlation by time period (i.e., year of study publication) similarly fails to illuminate a meaningful pattern of ever increasing or decreasing effect sizes. Specifically, for studies published (i) before 1997, M = −.110 (95% CI of −.224 to .007, n = 15), (ii) during the period 1998–2002, M = .092 (95% CI of .046 to .138, n = 42), (iii) during the period 2003–2007, M = .097 (95% CI of .064 to .131, n = 66), (iv) during the period 2008–2012, M = .140 (95% CI of .089 to .191, n = 90), and (v) during the period 2013–2017, M = .112 (95% CI of .044 to .180, n = 38). Thus, while the respective means for the last four time periods are each significantly stronger than the mean estimate for the time period “before 1997” (note, the mean for “before 1997” is not statistically significant), it should be noted that the respective means for each of the four, more recent time periods are not significantly different from one another.
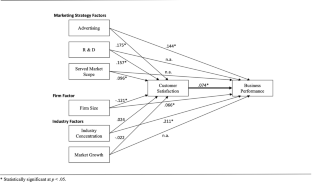
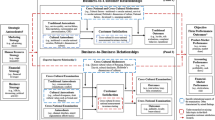
Prior to estimating the final PM models, a full mediating (FM) model (i.e., marketing strategy, firm, and industry factors only directly impacting satisfaction and satisfaction then directly impacting performance) was estimated to determine whether fit would be superior. The MASEM findings indicate that the FM model is a poor fitting model across the performance measure while the respective partial-mediating versions of those models can be considered to fit the data well. Regarding the FM pooled performance model, the χ 2 (6) of 67.34 is significant (p < .05), the CFI of .57 and TFI of .04 are below the critical threshold of .95 suggestive of a good fit, the SRMR of .05 is reasonable, but values of zero represent perfect fit, and the RMSEA of .11 and its 90% CI having an upper bound that exceeds .10 (CI = .087 to .133) are further indicants of poor fit. Similarly, the FM model is a poor fit for market share. The Δχ 2 (5) of 921.56 is significant (p < .05), the CFI is .06 and TFI is −1.06 (which is a non-normed value), the SRMR is .16, and the RMSEA of .48 with a 90% CI of .455 to .508 are also indicants of poor fit. Likewise, the FM model is a poor fit to the data when profit is the performance measure. The χ 2 (6) of 36.83 is significant (p < .05), the CFI of .72 and TFI of .40 are below the threshold of .95, the SRMR of .04 is reasonable, but the RMSEA of .08 and its 90% CI having an upper bound that exceeds .10 (CI = .055 to .104) are indicative of poor model fit. The resulting modification indices (in the case of each of these three FM models) pointed to estimating a partial mediating model instead, with one or more of the exogenous factors further exerting a direct effect on the respective performance metric.
References
- Adjei, M. T., Griffith, D. A., & Noble, S. M. (2009). When do relationships pay off for small retailers? Exploring targets and contexts to understand the value of relationship marketing. Journal of Retailing, 85(4), 493–501. ArticleGoogle Scholar
- Ailawadi, K. L., Dant, R. P., & Grewal, D. (2004). The difference between perceptual and objective performance measures: an empirical analysis. Cambridge: Marketing Science Institute. Google Scholar
- Aksoy, L., Cooil, B., Groening, C., Keiningham, T., & Yalcin, A. (2008). The long-term stock market valuation of customer satisfaction. Journal of Marketing, 72(4), 105–122. ArticleGoogle Scholar
- Anderson, E. W., Fornell, C., & Lehmann, D. R. (1994). Customer satisfaction, market share and profitability: findings from Sweden. Journal of Marketing, 58(3), 53–66. ArticleGoogle Scholar
- Anderson, E. W., Fornell, C., & Mazvancheryl, S. (2004). Customer satisfaction and shareholder value. Journal of Marketing, 68(4), 172–185. ArticleGoogle Scholar
- Barger, P. B., & Grandey, A. A. (2006). Service with a smile and encounter satisfaction: emotional contagion and appraisal mechanisms. Academy of Management Journal, 49(6), 1229–1238. ArticleGoogle Scholar
- Becker, B. J. (2009). Model-based meta-analysis. In H. Cooper, L. Hedges, & J. Valentine (Eds.), The handbook of research synthesis and meta-analysis (pp. 377–395). New York: Russell Sage Foundation. Google Scholar
- Beckers, S. F., van Doorn, J., & Verhoef, P. C. (2017). Good, better, engaged? The effect of company-initiated customer engagement behavior on shareholder value. Journal of the Academy of Marketing Science, 45(3), 1–18. Google Scholar
- Bendle, N. T., & Butt, M. N. (2018). The misuse of accounting-based approximations of Tobin’s q in a world of market-based assets. Marketing Science, 37(3), 484–504. ArticleGoogle Scholar
- Bergkvist, L., & Rossiter, J. R. (2007). The predictive validity of multiple-item versus single-item measures of the same constructs. Journal of Marketing Research, 44(2), 175–184. ArticleGoogle Scholar
- Bharadwaj, S. G., & Mitra, D. (2016). Satisfaction (Mis)pricing revisited: real? Really big? Journal of Marketing, 80(5), 116–121. ArticleGoogle Scholar
- Bharadwaj, S. G., & Varadarajan, R. (2004). Toward an integrated model of business performance. In N. K. Malhotra (Ed.), Review of marketing research (pp. 207–243). Armonk: M. E. Sharpe. Google Scholar
- Blundell, R., Griffith, R., & Van Reenen, J. (1999). Market share, market value and innovation in a panel of British manufacturing firms. The Review of Economic Studies, 66(3), 529–554. ArticleGoogle Scholar
- Bolton, R. N. (1998). A dynamic model of the duration of the customer’s relationship with a continuous service provider: the role of satisfaction. Marketing Science, 17(1), 45–65. ArticleGoogle Scholar
- Borenstein, S. (1991). Selling costs and switching costs: explaining retail gasoline margins. RAND Journal of Economics, 22(3), 354–369. ArticleGoogle Scholar
- Borenstein, M., Hedges, L. V., Higgins, J. P. T., & Rothstein, H. R. (2009). Introduction to meta-analysis. Chichester: Wiley. BookGoogle Scholar
- Bradburd, R. M., & Caves, R. E. (1982). A closer look at the effect of market growth on industries' profits. The Review of Economics and Statistics, 64(4), 635–645. ArticleGoogle Scholar
- Brown, S., & Lam, S. (2008). A meta-analysis of relationships linking employee satisfaction to customer responses. Journal of Retailing, 84(3), 243–255. ArticleGoogle Scholar
- Buzzell, R. D., & Wiersema, F. D. (1981). Modelling changes in market share: a cross-sectional analysis. Strategic Management Journal, 2(1), 27–42. ArticleGoogle Scholar
- Cai, G. (2010). Channel selection and coordination in dual-channel supply chains. Journal of Retailing, 86(1), 22–36. ArticleGoogle Scholar
- Camisón, C., & Forés, B. (2010). Knowledge absorptive capacity: new insights for its conceptualization and measurement. Journal of Business Research, 63(7), 707–715. ArticleGoogle Scholar
- Churchill, G. A., & Surprenant, C. (1982). An investigation into the determinants of customer satisfaction. Journal of Marketing Research, 19(4), 491–504. ArticleGoogle Scholar
- Cohen, J. (1988). Statistical power analysis for the behavioral sciences (2nd ed.). Hillsdale: Erlbaum. Google Scholar
- Cotterill, R. W., & Putsis, W. P. (2000). Market share and price setting behavior for private labels and national brands. Review of Industrial Organization, 17(1), 17–39. ArticleGoogle Scholar
- De Haan, E., Verhoef, P. C., & Wiesel, T. (2015). The predictive ability of different customer feedback metrics for retention. International Journal of Research in Marketing, 32(2), 195–206. ArticleGoogle Scholar
- Doorley, T. L., & Donovan, J. M. (1999). Value-creating growth: how to lift your company to the next level of performance. San Francisco: Jossey-Bass. Google Scholar
- Dunlap, W. P. (1999). A program to compute McGraw and Wong’s common language effect size indicator. Behavior Research Methods, Instruments, & Computers, 31(4), 706–709. ArticleGoogle Scholar
- Edvardsson, B., Jognson, M. D., Gustafsson, A., & Strandvik, T. (2000). The effects of satisfaction and loyalty on profits and growth: products versus services. Total Quality Management, 11(7), 917–927. ArticleGoogle Scholar
- Eisend, M. (2015). Have we progressed marketing knowledge? A meta-meta-analysis of effect sizes in marketing research. Journal of Marketing, 79(3), 23–40. ArticleGoogle Scholar
- Falk, T., Hammerschmidt, M., & Schepers, J. J. L. (2010). The service quality-satisfaction link revisited: exploring asymmetries and dynamics. Journal of the Academy of Marketing Science, 38(3), 288–302. ArticleGoogle Scholar
- Fornell, C. (1992). A national customer satisfaction barometer: the Swedish experience. Journal of Marketing, 55(1), 1–21. Google Scholar
- Fornell, C., Mithas, S., Morgenson, F. V., III, & Krishan, M. S. (2006). Customer satisfaction and stock prices: high returns, low risk. Journal of Marketing, 70(1), 1–14. ArticleGoogle Scholar
- Fornell, C., Morgeson, F. V., III, & Hult, G. T. M. (2016a). An abnormally abnormal intangible: stock returns on customer satisfaction. Journal of Marketing, 80(5), 122–125. ArticleGoogle Scholar
- Fornell, C., Morgeson, F. V., III, & Hult, G. T. M. (2016b). Stock returns on customer satisfaction do beat the market: gauging the effect of a marketing intangible. Journal of Marketing, 80(5), 92–107. ArticleGoogle Scholar
- Gatignon, H., & Hanssens, D. M. (1987). Modeling marketing interactions with application to salesforce effectiveness. Journal of Marketing Research, 24(3), 247–257. ArticleGoogle Scholar
- Geyskens, I., Stenkamp, J., & Kumar, N. (1999). A meta-analysis of satisfaction in marketing channel relationships. Journal of Marketing Research, 36(2), 223–238. ArticleGoogle Scholar
- Grewal, R., Chandrashekaran, M., & Citrin, A. (2010). Customer satisfaction heterogeneity and shareholder value. Journal of Marketing, 47(4), 612–626. ArticleGoogle Scholar
- Grewal, D., Puccinelli, N., & Monroe, K. B. (2018). Meta-analysis: integrating accumulated knowledge. Journal of the Academy of Marketing Science, 46(1), 1–22. ArticleGoogle Scholar
- Gruca, T., & Rego, L. (2005). Customer satisfaction, cash flow, and shareholder value. Journal of Marketing, 69(3), 115–130. ArticleGoogle Scholar
- Harbord, R. M., & Higgins, J. P. (2008). Meta-regression in Stata. Meta, 8(4), 493–519. Google Scholar
- Hartung, J., Knapp, G., & Sinha, B. K. (2011). Statistical meta-analysis with applications (Vol. 738). Hoboken: Wiley. Google Scholar
- Higgins, J. P. T., Thompson, S. G., Deeks, J. J., & Altman, D. G. (2003). Measuring inconsistency in meta-analyses. BMJ [British Medical Journal], 327(7414), 557–560. ArticleGoogle Scholar
- Homburg, C., Koschate, N., & Hoyer, W. D. (2005). Do satisfied customers really pay more? A study of the relationship between customer satisfaction and willingness to pay. Journal of Marketing, 69(2), 84–96. ArticleGoogle Scholar
- Homburg, C., Allmann, J., & Klarmann, M. (2014). Internal and external price search in industrial buying: the moderating role of customer satisfaction. Journal of Business Research, 67(8), 1581–1588. ArticleGoogle Scholar
- Hurley, R. F., & Estelami, H. (1998). Alternative indexes for monitoring customer perceptions for services quality: a comparative evaluation in retailing. Journal of the Academy of Marketing Science, 26(3), 209–221. ArticleGoogle Scholar
- Jacobson, R., & Mizik, N. (2009). Rejoinder—customer satisfaction-based mispricing: issues and misconceptions. Marketing Science, 28(5), 836–845. ArticleGoogle Scholar
- Jak, S. (2015). Meta-analytic structural equation modelling. New York City: Springer. BookGoogle Scholar
- Johnson, M. S., Garbarino, E., & Sivadas, E. (2006). Influences of customer differences of loyalty, perceived risk and category experience on customer satisfaction ratings. International Journal of Market Research, 48(5), 601–622. ArticleGoogle Scholar
- Jones, M. A., & Suh, J. (2000). Transaction-specific satisfaction and overall satisfaction: an empirical analysis. Journal of Services Marketing, 14(2), 147–159. ArticleGoogle Scholar
- Keiningham, T. L., Aksoy, L., Cooil, B., Andreassen, T. W., & Williams, L. (2008). A holistic examination of net promoter. Journal of Database Marketing & Customer Strategy Management, 15(2), 79–90. ArticleGoogle Scholar
- Koschat, M. A. (2008). Store inventory can affect demand: empirical evidence from magazine retailing. Journal of Retailing, 84(2), 165–179. ArticleGoogle Scholar
- Kumar, V. (2016). Introduction: is customer satisfaction (ir) relevant as a metric? Journal of Marketing, 80(5), 108–109. ArticleGoogle Scholar
- Lehmann, D. R., & Reibstein, D. J. (2006). Marketing metrics and financial performance. Cambridge: Marketing Science Institute. Google Scholar
- Loo, R. (2002). A caveat on using single-item versus multiple-item scales. Journal of Managerial Psychology, 17(1), 68–75. ArticleGoogle Scholar
- Luo, X., & Homburg, C. (2007). Neglected outcomes of customer satisfaction. Journal of Marketing, 71(2), 133–149. ArticleGoogle Scholar
- Luo, X., & Homburg, C. (2008). Satisfaction, complaint, and the stock market gap. Journal of Marketing, 72(4), 29–43. ArticleGoogle Scholar
- Luo, X., Homburg, C., & Wieseke, J. (2010). Customer satisfaction, analyst stock recommendations, and firm value. Journal of Marketing Research, 47(6), 1041–1058. ArticleGoogle Scholar
- Luo, X., Wieseke, J., & Homburg, C. (2012). Incentivizing CEOs to build customer-and employee-firm relations for higher customer satisfaction and firm value. Journal of the Academy of Marketing Science, 40(6), 745–758. ArticleGoogle Scholar
- Maiga, A. S., Nilsson, A., & Jacobs, F. A. (2013). Extent of managerial IT use, learning routines, and firm performance: a structural equation modeling of their relationship. International Journal of Accounting Information Systems, 14(4), 297–320. ArticleGoogle Scholar
- McGraw, K. O., & Wong, S. P. (1992). A common language effect size statistic. Psychological Bulletin, 111(2), 361–365. ArticleGoogle Scholar
- Mittal, V., & Kamakura, W. A. (2001). Satisfaction, repurchase intent, and repurchase behavior: investigating the moderating effect of customer characteristics. Journal of Marketing Research, 38(1), 131–142. ArticleGoogle Scholar
- Mittal, V., Kamakura, W. A., & Govind, R. (2004). Geographic patterns in customer service and satisfaction: an empirical investigation. Journal of Marketing, 68(3), 48–62. ArticleGoogle Scholar
- Morgan, N. A., & Rego, L. L. (2006). The value of different customer and loyalty metrics in predicting business performance. Marketing Science, 25(5), 426–439. ArticleGoogle Scholar
- Oliver, R. L. (2010). Satisfaction: A behavioral perspective on the consumer (2nd ed.). London: ME Sharp Incorporated. Google Scholar
- Palmatier, R. W., Dant, R. P., Grewal, D., & Evans, K. R. (2006). Factors influencing the effectiveness of relationship marketing: a meta-analysis. Journal of Marketing, 70(4), 136–153. ArticleGoogle Scholar
- Parasuraman, A., Zeithaml, V. A., & Berry, L. L. (1985). A conceptual model of service quality and its implications for future research. Journal of Marketing, 49(4), 41–50. ArticleGoogle Scholar
- Rego, L. L., Morgan, N. A., & Fornell, C. (2013). Reexamining the market share–customer satisfaction relationship. Journal of Marketing, 77(5), 1–20. ArticleGoogle Scholar
- Reichheld, F. F., & Sasser, W. E., Jr. (1990). Zero defections: quality comes to services. Harvard Business Review, 68(5), 105–111. Google Scholar
- Robinson, W. T. (1988). Sources of market pioneer advantages: the case of industrial goods industries. Journal of Marketing Research, 25(1), 87–94. ArticleGoogle Scholar
- Romano, J. L., & Kromrey, J. D. (2009). What are the consequences if the assumption of independent observations is violated in reliability generalization meta-analysis studies? Educational and Psychological Measurement, 69(3), 404–428. ArticleGoogle Scholar
- Rothstein, H. R., & Hopewell, S. (2009). Grey literature. In H. Cooper, L. Hedges, & J. Valentine (Eds.), The handbook of research synthesis and meta-analysis (pp. 103–125). New York: Russell Sage Foundation. Google Scholar
- Röver, C., Knapp, G., & Friede, T. (2015). Hartung-Knapp-Sidik-Jonkman approach and its modification for random-effects meta-analysis with few studies. BMC Medical Research Methodology, 15(1), 99–105. ArticleGoogle Scholar
- Rubera, G., & Kirca, A. H. (2017). You gotta serve somebody: the effects of firm innovation on customer satisfaction and firm value. Journal of the Academy of Marketing Science, 45(5), 741–761. ArticleGoogle Scholar
- Ruef, M., & Scott, W. R. (1998). A multidimensional model of organizational legitimacy: hospital survival in changing institutional environments. Administrative Science Quarterly, 43(4), 877–904. ArticleGoogle Scholar
- Rust, R. T., & Zahorik, A. J. (1993). Customer satisfaction, customer retention and market share. Journal of Retailing, 69(2), 193–215. ArticleGoogle Scholar
- Schmidt, F. L., & Hunter, J. E. (2015). Methods of meta-analysis: correcting error and bias in research findings (3rd ed.). Los Angeles: Sage Publications. BookGoogle Scholar
- Shackman, G. (2001). Sample size and design effect. Albany Chapter of American Statistical Association, http://faculty.smu.edu/slstokes/stat6380/deff%20doc.pdf. Accessed August 2017.
- Singh, J., & Sirdeshmukh, D. (2000). Agency and trust mechanisms in consumer satisfaction and loyalty judgments. Journal of the Academy of Marketing Science, 28(1), 150–167. ArticleGoogle Scholar
- Slater, S. F., & Narver, J. C. (1994). Does competitive environment moderate the market orientation-performance relationship? The Journal of Marketing, 58(1), 46–55. ArticleGoogle Scholar
- Song, R., Jang, S., & Cai, G. G. (2016). Does advertising indicate product quality? Evidence from prelaunch and postlaunch advertising in the movie industry. Marketing Letters, 27(4), 791–804. ArticleGoogle Scholar
- Sorescu, A., & Sorescu, S. M. (2016). Customer satisfaction and long-term stock returns. Journal of Marketing, 80(5), 110–115. ArticleGoogle Scholar
- Sridhar, S., Narayanan, S., & Srinivasan, R. (2014). Dynamic relationships among R&D, advertising, inventory and firm performance. Journal of the Academy of Marketing Science, 42(3), 277–290. ArticleGoogle Scholar
- Swaminathan, V., Groening, C., Mittal, V., & Thomaz, F. (2014). How achieving the dual goal of customer satisfaction and efficiency in mergers affects a firm’s long-term financial performance. Journal of Service Research, 17(2), 182–194. ArticleGoogle Scholar
- Szymanski, D. M., & Henard, D. H. (2001). Customer satisfaction: a meta-analysis of the empirical evidence. Journal of the Academy of Marketing Science, 29(1), 16–35. ArticleGoogle Scholar
- Szymanski, D. M., Bharadwaj, S. G., & Varadarajan, R. (1993). An analysis of the market share-profitability relationship. Journal of Marketing, 57(3), 1–18. ArticleGoogle Scholar
- Szymanski, D. M., Kroff, M., & Troy, L. C. (2007). Innovativeness and new product success: insights from the cumulative evidence. Journal of the Academy of Marketing Science, 35(1), 35–52. ArticleGoogle Scholar
- Teece, D. J., Pisano, G., & Shuen, A. (1997). Dynamic capabilities and strategic management. Strategic Management Journal, 18(7), 509–533. ArticleGoogle Scholar
- Tellis, G. J. (1988). The price elasticity of selective demand: a meta-analysis of econometric models of sales. Journal of Marketing Research, 25(4), 331–341. ArticleGoogle Scholar
- Terpstra, M., & Verbeeten, F. H. (2014). Customer satisfaction: cost driver or value driver? Empirical evidence from the financial services industry. European Management Journal, 32(3), 499–508. ArticleGoogle Scholar
- Thursyanthy, V., & Tharanikaran, V. (2017). Antecedents and outcomes of customer satisfaction: a comprehensive review. International Journal of Business and Management, 12(4), 144–156. ArticleGoogle Scholar
- Van Doorn, J., & Verhoef, P. (2008). Critical incidents and the impact of satisfaction on customer share. Journal of Marketing, 72(4), 123–142. ArticleGoogle Scholar
- Verhoef, P. C., Kannan, P. K., & Inman, J. J. (2015). From multi-channel retailing to omni-channel retailing: introduction to the special issue on multi-channel retailing. Journal of Retailing, 91(2), 174–181. ArticleGoogle Scholar
- Vorhies, D. W., Morgan, R. E., & Autry, C. W. (2009). Product-market strategy and the marketing capabilities of the firm: impact on market effectiveness and cash flow performance. Strategic Management Journal, 30(12), 1310–1334. ArticleGoogle Scholar
- Voss, G. B., Godfrey, A., & Seiders, K. (2010). How complimentary and substitution alter the customer-repurchase link. Journal of Marketing, 74(4), 111–127. ArticleGoogle Scholar
- Wall, T. D., Michie, J., Patterson, M., Wood, S. J., Sheehan, M., Clegg, C. W., & West, M. (2004). On the validity of subjective measures of company performance. Personnel Psychology, 57(1), 95–118. ArticleGoogle Scholar
- Wiley, J. W. (1991). Customer satisfaction: a supportive work environment and its financial cost. People and Strategy, 14(2), 117–127. Google Scholar
- Williams, P., & Naumann, E. (2011). Customer satisfaction and business performance: a firm-level analysis. Journal of Services Marketing, 25(1), 20–32. ArticleGoogle Scholar
- Yang, J. (2010). The knowledge management strategy and its effect on firm performance: a contingency analysis. International Journal of Production Economics, 125(2), 215–223. ArticleGoogle Scholar
- Yu, W., Jacobs, M. A., Salisbury, W. D., & Enns, H. (2013). The effects of supply chain integration on customer satisfaction and financial performance: an organizational perspective. International Journal of Production Economics, 146(1), 346–358. ArticleGoogle Scholar
- Zhang, J., Wedel, M., & Pieters, R. (2009). Sales effects of attention to feature advertisements: a Bayesian mediation analysis. Journal of Marketing Research, 46(5), 669–681. ArticleGoogle Scholar
Author information
Authors and Affiliations
- Hankamer School of Business, Baylor University, One Bear Place #98007, Waco, TX, 76798, USA Ashley S. Otto
- University of North Florida, 1 UNF Drive, Jacksonville, FL, 32224, USA David M. Szymanski
- Mays Business School, Texas A&M University, 4112 TAMU, College Station, TX, 77843, USA Rajan Varadarajan
- Ashley S. Otto
